Article of the Month -
February 2018
|
The use of Volunteered Geographic
Information (VGI) in noise mapping
 |
 |
 |
 |
 |
| Bakogiannis
Efthimios |
Charalampos
Kyriakidis |
Maria Siti |
Nikolaos
Kougioumtzidis |
Chryssy Potsiou |
This paper was presented
at the conference in Bucharest, Romania. The aim of this paper is to
present an overview of a research about the monitoring of the urban
acoustic environment affordably and reliably, and investigating the
potential use of Volunteered Geographic Information (VGI) for such
applications in typical medium-sized cities.
SUMMARY
The quality of the soundscape in cities is a significant parameter
that influences the percentage of population affected by noise and is a
component of the “nuisance” indicator often used for the assessment of
the urban environmental sustainability in Europe. However, limited
attention has been given by planners to the acoustic environment of a
city so far. In Greece, research on this issue and its representation at
the city scale has been conducted only for a limited number of large
cities, whereas in most of the cities and towns there is no available
data.
The aim of this paper is to present an overview of a research about
the monitoring of the urban acoustic environment affordably and
reliably, and investigating the potential use of Volunteered Geographic
Information (VGI) for such applications in typical medium-sized cities.
This research is conducted as part of the ongoing Sustainable Urban
Mobility Plan projects (SUMP), aiming to improve the urban landscape,
increase quality of life and transform cities into more compact and
liveable urban cores.
Once the urban design characteristics are listed
by the experts, audio recordings are collected through crowdsourcing
(using apps in smart phones) in several city spots, according to a
grid-based sampling methodology. Then, a sound map is created using the
Ordinary Kriging technique in GIS, while finally the collected noise
data are imported in OpenStreetMap (OSM) by the volunteers. The
methodology was tested in two Greek medium-sized city centers (Kozani
and Drama). The soundscape data were then assessed by taking into
consideration the European and national legislation about the urban
acoustic environment as well as the various characteristics of each
study area. As expected, results show that residents are exposed to high
sound levels during the day. However, sound levels in car-free zones are
considerably lower except from specific streets where motorcycles enter
illegally (for delivery or freight purposes).
In overall, this research proved that there is a strong potential of
using crowdsourcing techniques to collect noise data and monitor the
soundscape reliably and affordably. It is crucial for the municipalities
to engage citizens in participating to urban renewal projects in main
streets as well as in vulnerable or sensitive city areas (i.e.
neighborhoods, school zones) in order to raise awareness about noise
pollution and create a better acoustic environment. Through these case
studies, this paper points out that crowd sourced noise mapping may be
utilized as a reliable tool for participatory planning. The paper
provides considerations on how the proposed methodology may be further
tested and improved.
1. CONSIDERING NEW TECHNOLOGIES FOR RECORDING THE URBAN SONIC
ENVIRONMENT
Over 50 years have passed since Murray Schafer studied the influence
of the sonic environment on people. However, the term “soundscape”,
which was used to explain this relationship (Rodriguez-Manzo, et.al.,
2015; Schulte-Fortkamp and Jordan, 2016), is still up-to-date. Another
contemporary issue has to do with the transformations of the soundscape.
In contrast with the natural and urban environment, where the
differentiations could be easily understandable through aerial
photography techniques of remote sensing and mapping tools, the
investigation of the changes that occur in the soundscape (Schaffer,
1993) is not easy due to the fact that, in many areas, mapping of the
soundscape is not carried out although it constitutes a useful tool for
the evaluation of buildings and urban areas (Schulte-Fortkamp and
Jordan, 2016).
The view of Maffei et.al. (2012) and Margaritis et.al.(2015), that
the sonic environment does not consist of a significant parameter in the
urban planning practice is well-founded even in Greece, where the only
official mapping of the soundscape has been carried out between
2012-2016 only in specific cities, based on the 13586/724/2006 Joint
Ministerial Decision (FEK B’ 384) that followed and embodied the
European Directive 2002/49/ΕC (Vogiatzis and Remy, 2017), aimed at
confronting high levels of noise in cities using common ways for all
EU country members (Stoter, et.al., 2008; Licitra and Memoli, 2008).
However, these mapping projects do not constitute a complete
representation of the sonic environment, but only the environmental
noise [Strategic Noise Maps (S.N.M) and Noise Action Plans(N.A.P.)]
(Directive 2002/49/EC), which is only a parameter of the sonic
environment according to Rodriguez-Manzo et.al.(2015). The interest in
noise links to the fact that noise pollution is an essential problem in
urban areas (Schweizer, et.al., 2011; Pödör and Révész, 2014; Pödör,
et.al., 2015; Rodriguez-Manzo, et.al., 2015; Poslončec-Petrić, et.al.,
2016; Pödör and Zentai, 2017). Indeed, Vasilev (2017) points out that
the increase of noise levels (0,5-1,0 dBA) in cities is a reality.
Regarding the measurements and monitoring of noise levels, different
methodologies have been occasionally suggested. Such methodologies are:
noise recordings, population surveys and interviews, soundwalks and
noise mapping (Rodriguez-Manzo, et.al., 2015; Schulte-Fortkamp and
Jordan, 2016). Even for individual procedures, different techniques have
been proposed. In noise mapping, for instance, different methods and
tools can be used (Bennett et.al., 2010; Schulte-Fortkamp and
Jordan,2016) for data collection and representation. Indeed, according
to Schulte-Fortkamp and Jordan (2016), the natural conditions of a
soundscape can be measured by using binaural recording devices or
microphone arrays. Maps can be created by algorithms that produce maps
based on estimations or by using measured data (Cho, et.al., 2007;
Stoter, et.al., 2008). In practice, due to high cost (Schweizer, et.al.,
2011), local authorities choose to monitor soundscape by placing sensors
in specific points, that usually do not cover the total surface of a
city. According to Aiello et.al. (2016), this particular method is
a result of the European Directive 2002/49/ΕC, which requires European
countries to monitor noise levels produced by specific sources (road
traffic, railways, airports and industry). The same researchers (Aiello
et.al., 2016) point out that, due to many deficiencies observed,
epidemiological models are occasionally used for estimating noise
levels. These models are based on samples of small population or data
derived from smartphones or social media, in order to decrease the cost
of such research. The research of Podor and Revesz (2014), Podor et al.
(2015) and Podor and Zentai (2017) converge to the same opinion and
argue that it is fundamental to use data derived from crowdsensoring and
crowdsourcing for monitoring noise levels. That is why, according to the
European Directive 2002/49/ΕC, noise maps must be renewed every 5 years,
a task that is restricted by the economic conditions of certain
countries such as Hungary, to which these researches are referred, if
the used methods are the conventional ones.
During recent years, the European Commission has financed projects
that are based on crowdsourcing in which people have been used as
“sensors” (Podor, et.al., 2015). In these projects, people carry their
smartphones that are personal devices equipped with applications that
provide data without cost (Schweizer, et.al., 2011). According to
Schweizer, et.al. 2011, smartphones constitute ideal platforms for
environmental data measurements as, beyond sound levels that are
recorded by the microphone which is incorporated in the device, they are
also equipped with GPS providing spatial information at the same time.
The advantages of smartphones is that they can be used in order for
researchers to achieve goals like: (a) low-cost data collection process,
(b) citizens’ participation for improving the quality of urban
environment and (c) constant monitoring of the soundscape, when people
use applications providing real time data.
From the above can be concluded that participation of people consists
a significant process on which this paper focuses. The reasons are: (a)
volunteered participation is a necessary parameter in order to collect
data with low-cost budget (Schulte-Fortkamp and Jordan, 2016), (b)
volunteered participation has a great additional value as it constitutes
a process that increases the geospatial maturity of the society to
understand the design procedures and various planning matters
(Athanasopoulos and Stratigea, 2015; Bakogiannis, et.al., 2017) and (c)
the participation of people is an example of direct democracy that seals
transparency and social consensus through a structured dialogue
procedure and interaction (Kyriakidis, 2012).
The methodology proposed in this paper builds up on the
aforementioned literature elements focusing on noise data collection by
volunteers using a specific application. The pilot testing on the
methodology in the Greek cities of Kozani and Drama is later presented
in detail.
2. METHODOLOGY
2.1. Aim and Objectives
Considering that noise mapping is required only for major cities of
each EU member country, and considering the lack of financial resources
of some EU states (e.g. Greece) to meet this requirement and expand this
practice to other cities (e.g. mid-sized cities), it is worthwhile
questioning to what extent crowdsourcing techniques could assist in
developing noise maps for mid-sized cities. Thus, the aim of this paper
is to develop a methodology for noise monitoring. This methodology
should be easily applicable, reliable and cost-effective.
The case studies presented here focus on Greek cities, where
Sustainable Urban Mobility Plans (SUMP) are implemented. The above
research question is well-founded given the fact that the soundscape is
essential for the promotion of integrated urban and transportation
planning (e.g., reduction of noise levels in areas where it is
particularly intense). Moreover, soundscape could be used as an
indicator for the SUMP by comparing the previous to the subsequent noise
levels.
The main objectives of this study are to:
- examine if the results of surveys carried out by smart
phone equipment are satisfactory and
- promote the concept of open noise data as far as concerning the
studied cities, by uploading it in Open Street Map (OSM).
2.2. Proposed Methodology
In literature (Rodriguez-Manzo, et.al., 2015; Schulte-Fortkamp and
Jordan, 2016), there are many ways for recording and mapping the cities’
soundscape. Such examples are soundwalks, sound recordings and
interviews with experts and locals. However, according to current
research, citizens’ participation consists of a usual process in smart
cities’ projects (Poslončec-Petrić, et.al., 2016).
This trend relates to the time-consuming process of traditional noise
mapping as well as to the cost of its implementation. Indeed, the
methodology typically used for producing strategic noise maps includes
the existence of data-sets such as 3D digital ground models, city
traffic models, train traffic models (in case a train station is located
in the city under study) and the use of an ideal software for mapping
the sound levels (Garai and Fattori, 2009). In many European cities (and
in most Greek cities) there is no available data of such type and its
collection is costly. According to the Report entitled “Best Practice in
Strategic Noise Mapping”, developed by the subgroup END noise mapping of
the CEDR Project Group Road Noise 2 (2013), the cost of noise mapping is
significant; an approximate estimation of the average total cost for
noise mapping per km mapped is € 604.
In this research, as drafted and tested in Kozani and Drama, a new
methodology was used in order to map the noise levels. The methodology
diagram is graphically presented in Figure 1, including the following
steps: a) Study area selection, b) field sampling organization, c)
preparing the volunteers, d) recordings- data collection, e) data
digitization by volunteers in OSM, f) publishing the maps. In these
steps a team of experts shall enhance the maps produced and assist
volunteers in developing a readable and useful map. Although this
methodology differs from the one usually preferred, however, it could be
an easily applicable and cost-effective alternative for monitoring
noise, mainly in small and mid-sized cities. It is also important that
through importing data into OSM, it is possible to create an interactive
noise map. The next step will be to put in place a dynamic map in which
the data collected by the residents through their smartphones will be
presented simultaneously on the map. In that way, noise will be
constantly monitored and presented in the wide public.
For the research in Kozani and Drama, the methodology was organized
as presented below.
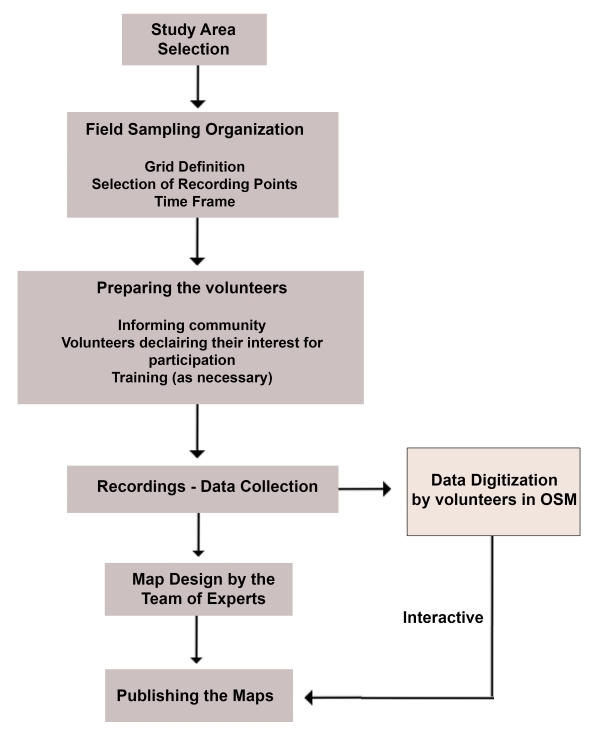
Figure 1: Block diagram of the proposed
methodology. Source: Own Elaboration.
2.2.1. Study areas selection
The cities chosen for this research are medium-sized cities of
Greece. Kozani is located in the Region of West Macedonia, Greece; and
its population is 41.066 residents (2011 census). Drama is located in
the Region of Eastern Macedonia and Thrace; and its population is 44.823
residents (2011 census). The two cities were selected for this paper due
to their common characteristics (e.g. population; their central
districts have been developed without strict city plans over the
centuries; arterial roads are passing through their central districts;
their central districts display analogous land use dispersion and
clustering; neither Strategic Noise Map. nor Noise Action Plans have
been conducted for Kozani and Drama as they are medium-sized cities and
there is no obligation to implement them, according to Dir. 2002/49/EC).
The study areas in these two cities involve a number of central
functions and a mix of land uses, with commercial, recreational and
administrative uses being dominant. These areas are expected to present
several land use conflicts due to their functional centrality and the
accumulation of high people-concentration especially at peak times.
Considering the above, central districts of Kozani and Drama were
selected as study areas for the field research. Due to differences in
the geography of these two cities, different number of recordings have
been conducted in each one (Figure 2).
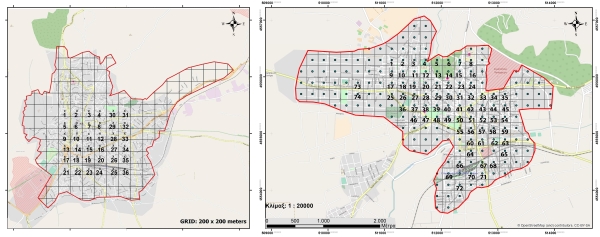
Figure 2. Field sampling organization: Recording
points in the study areas of Kozani (left) and Drama (right).
Source: Own Elaboration. (click for larger size)
2.2.2. Data collection
The data collection was carried out with the help of volunteers
(crowdsourcing), who used their smartphones, following the paradigm of a
series of similar surveys (Pödör and Révész, 2014; Garcia-Marti, 2014;
Aletta, et.al., 2016). The volunteers participated in the research, upon
invitation. Volunteers had no hearing or vision problems.
The chosen method conforms to that of systematic sampling, where
sampling points are selected using a grid for selecting points. This
method was used as it adequately covers all study areas.
The grid dimensions for the calculation of the points in the two
cities were defined as 200 x 200 m. separating the study areas in
squares of 200 m. sides, similar to the research by Margaritis et.al.
(2015). The recording points were located at the center of the squares
(as shown in Figure 2), whereas in cases where measurements at the
designated points were not possible due to physical and/or legal
restrictions (e.g., buildings, private space etc.), closest points were
selected.
The calculation and assessment process took place at different time
periods for the two cities: March 2017 in Kozani and July 2017 in Drama
(for one week in both cities). The volunteers (3 volunteers in each
city) recorded noise levels (quantitative data) in the various sites for
2 minutes each, using the Sound Meter digital sound recorder, a free
smartphone application. This application measures the sound level (or
SPL), which is calculated from the following equation (Raymond, n.r.):
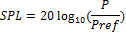
Where the variables stand for:
SPL = sound pressure level, decibels (db)
P = sound wave pressure, newtons/meter2
Pref = reference pressure or hearing threshold, newton/meter2
The duration of recordings was 3-4 hours/day. The same process was
repeated every day for a week. In order to reduce faulty results, a
member of the team of experts collects the data with the volunteers
during the first day of recordings. Thus, it is possible to answer to
any question concerning the recording process. This process consists of
a pilot study.
Volunteers also kept a draft calendar in which they reported the type
of the sounds they heard (qualitative data) during the recording
process. These data were collected in order for the SUMPs of Kozani and
Drama to be implemented. Measurements were taken during both working and
non-working hours. However, the analysis assessed measurements that were
taken only in working hours because: (a) cities have more residents and
visitors on the move during these hours, and (b) the study areas are
more congested at working hours and therefore noise levels are higher.
2.2.3. Noise maps production
Upon completion of the field survey, the recordings were mapped using
QGIS and ArcGIS software. Different software was used to produce maps in
each city, as the cities were studied through different research
programs. The maps produced included variables according to: (a) the
average value of the recorded noise levels; (b) the minimum values; and
(c) the peak values for working hours.
The mapping process is usually implemented by using various
interpolation techniques (Margaritis, et.al., 2015). Li and Heap (2008)
present 26 interpolation techniques that are quite similar and can be
performed for mapping processes. Geymen and Bostanci (2012) support that
Inverse Distance Wight Method (IDW), Ordinary Kriging Method (OK) and
Redial Basis Functions Method (RBF) are the three most useful methods
for noise mapping, as they have selected these techniques for
representation of noise values. Margaritis et.al. (2015) underline that
Kriging and IDW techniques are the most widely known in the field of
noise mapping. However, the literature review (Geymen and Bostanci,
2012; Aletta and Kang, 2015; Margaritis, et.al., 2015) showed that the
Kriging technique is a powerful method, most frequently preferred for
similar purposes. Based on the above, Kriging methodology was selected
for mapping in these studies. The 2D raster surfaces were created based
on the OK Method considering all the points of each study area. Adobe
Photoshop CC14 was also used for improving the aesthetic of the maps.
The analysis and mapping process presented above was conducted by the
team of experts who were coordinating the data collection process.
Finally, maps were uploaded by volunteers in the Open Street Map
platform in order to provide free access information for anyone
interested. Due to the fact that volunteers were people with some
technical skills, not much special training was necessary. However, in
case volunteers need to be trained, a short training session with
instructions could be organized at the initial stage of the field
research.
2.2.4. Limitations
Research limitations are mainly related to the time frame of the
research. The field research has been conducted at different times for
each city, as they were part of different projects with different time
frames and deadlines.
As for risk management, a moving vehicle could cause bodily injury
and property damage to volunteers and researchers. Moreover, the
volunteers had to conduct the research during spring and summer when the
temperature is high and they had to be exposed in the sun for many hours
a day.
3. ANALYSIS AND RESULTS
Although the derived noise data were collected over a one-week period
in 2017 by volunteers who recorded noise at the street level, they
handed in quite rational noise maps, as expected. On that basis, it
could be considered that results are reliable enough to draw the
conclusions presented below.
Using QGIS and ArcGIS, collected data were presented as a point
feature layer. In order to realize where there is a spatial relationship
among the values (minimum, maximum and mid values) represented by each
point feature, the OK method was used. Figures 3 and 4 depict noise maps
for each city. The noise maps were developed by taking into account that
mid values are the most important as they capture a more in-depth
analysis by excluding extreme (min and max) values.
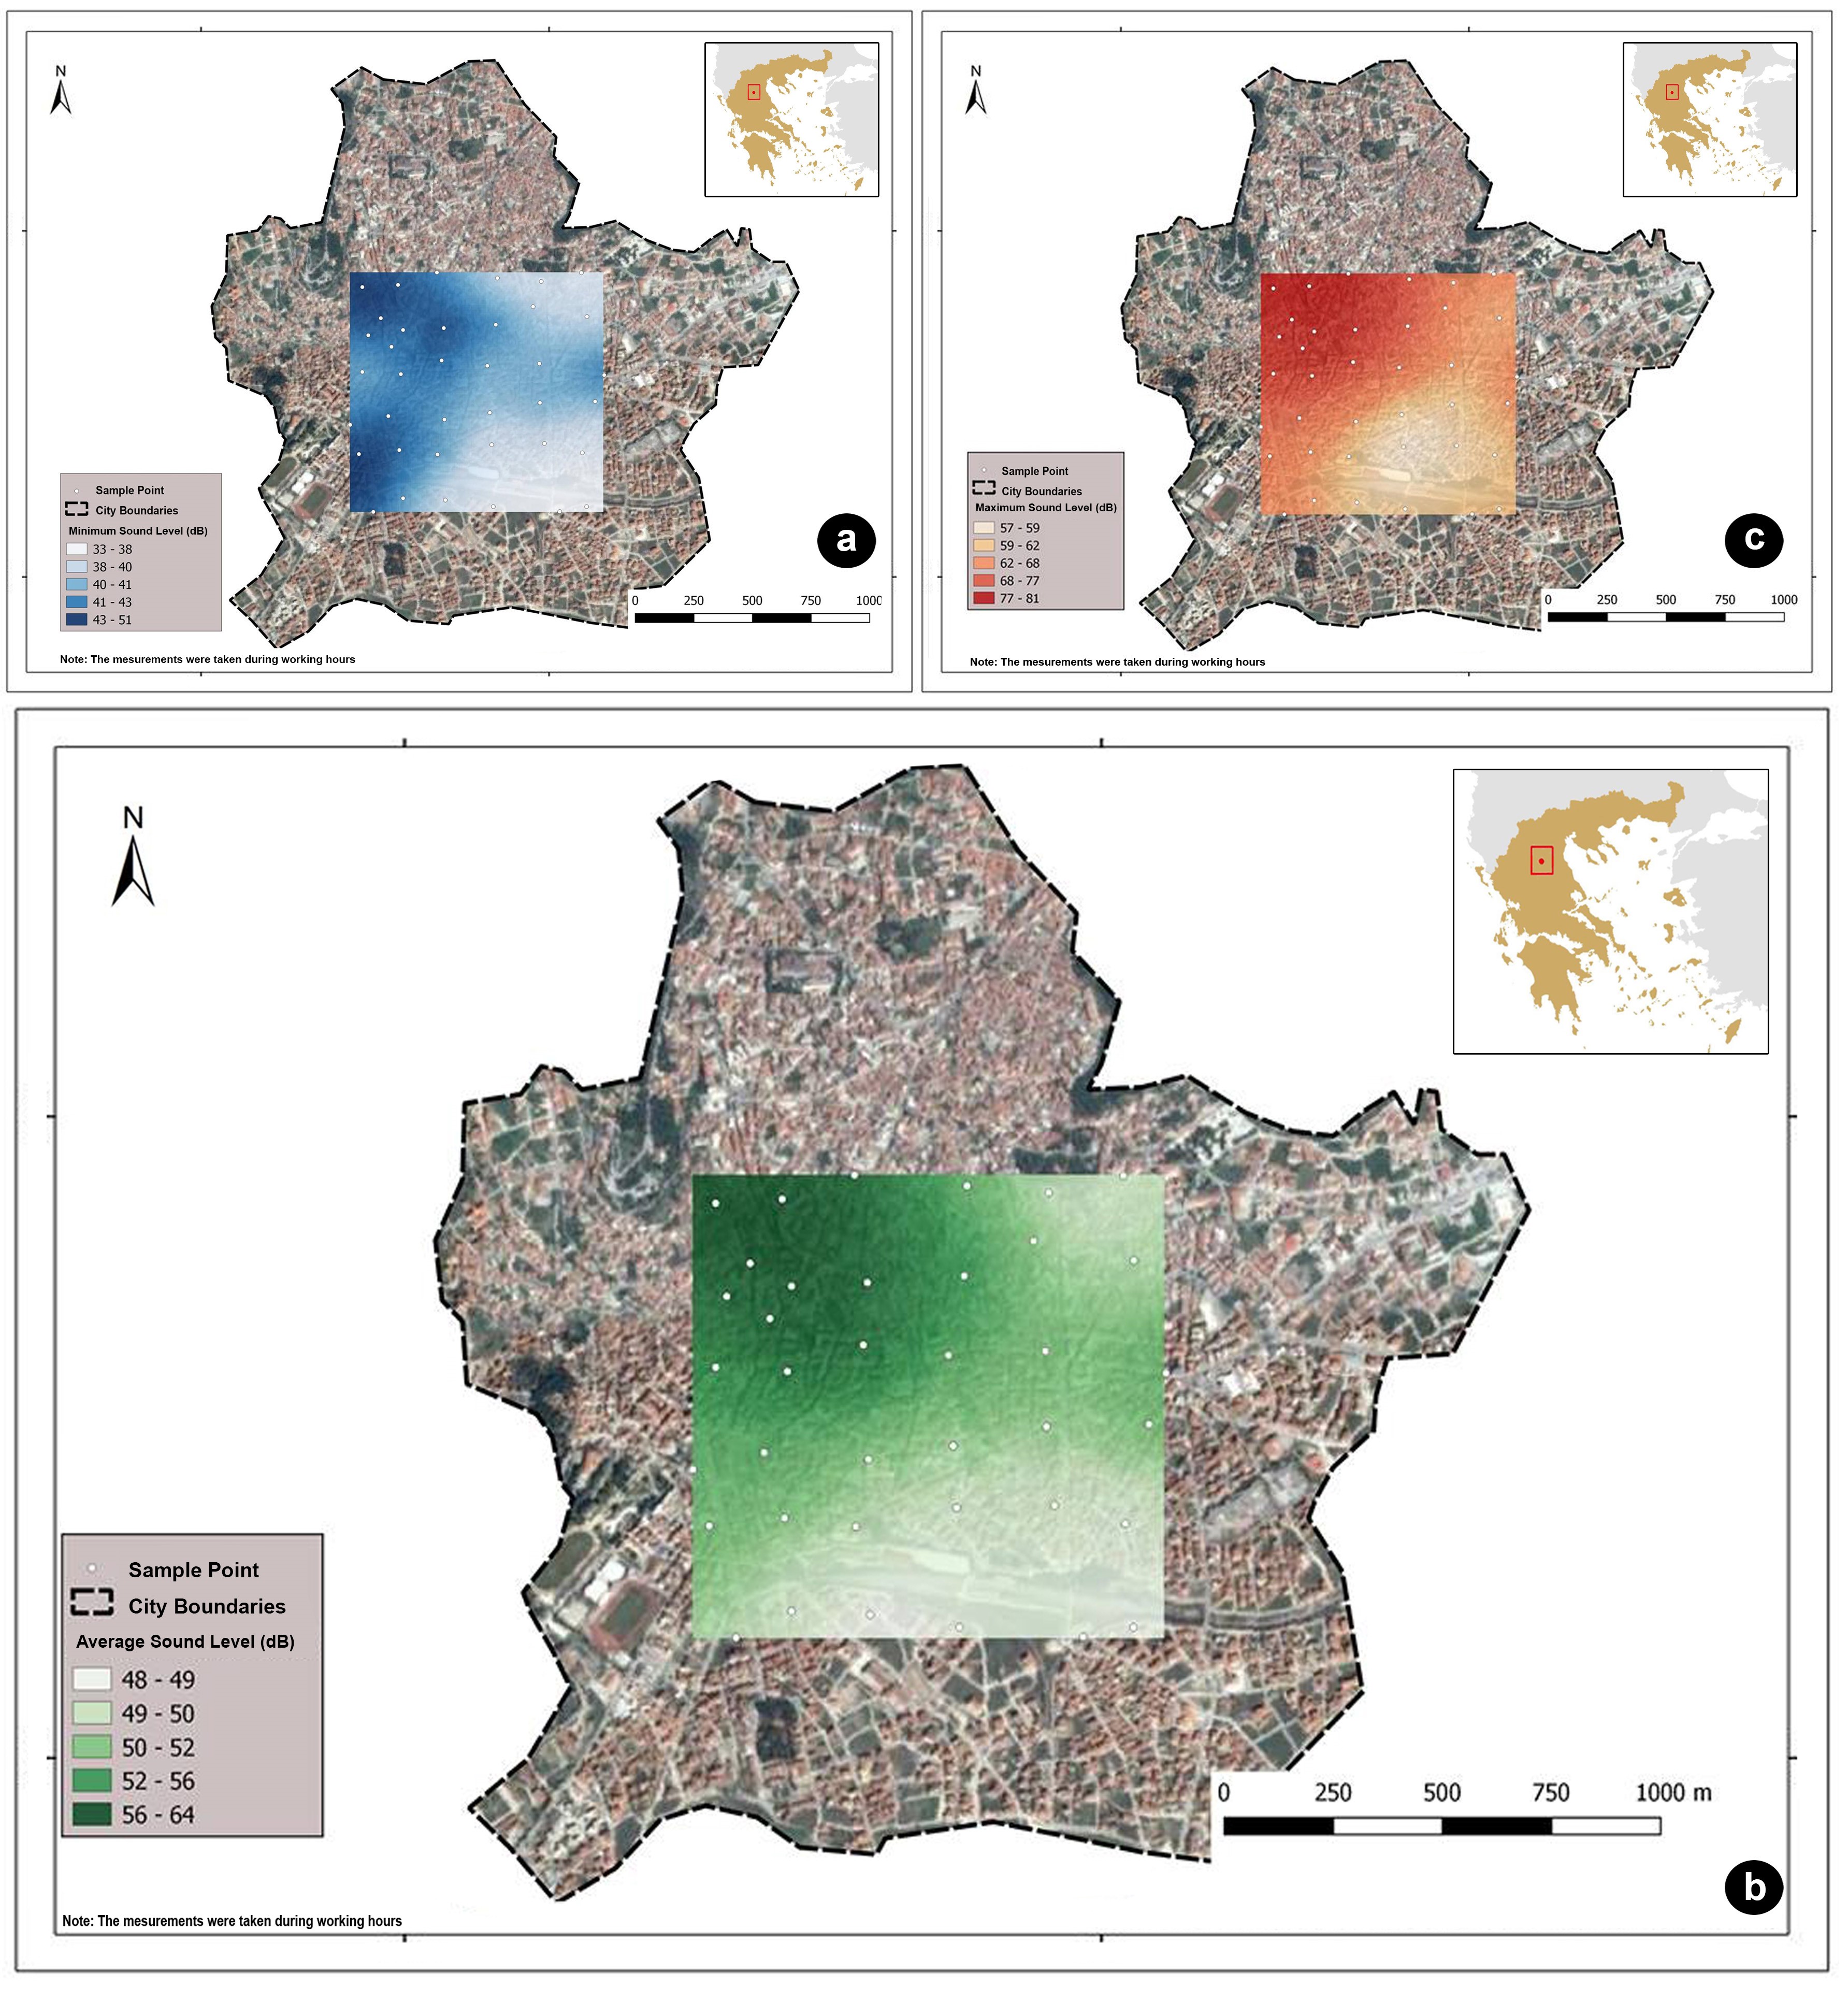
The results for Kozani could be concluded in the following points:
- High intensity noise was noticed in Kozani averaging from
39 to 64 dB. As seen in Figure 3b, sounds recorded in a large part
of the study area are higher than 55 Db, which is the noise level
defined by the World Health Organization as the limit at which
people are at serious health risk.
- Higher intensity sounds were recorded at the northwest region of
the study area, due to the following facts: (a) the existence of
busy streets (i.e. Dimokratias Str., Fon Kozani Str., Paulou Mela
Str., M. Alexandrou Str.), (b) the concentration of a large number
of commercial/ recreation stores and (c) administrative uses and
points of high interest.
- Values higher than 84dB (Figure 3c) -sometimes ephemeral- were
recorded in a large part of the city. This is a worrying fact,
considering that the 87 dB threshold is the limit set by the Greek
law (Presidential Decree 149/2006) for a maximum fixed exposure
value for a worker in an 8-hour work day.
- Noise levels are
relatively high, even in the case of the minimum values (30dB)
recorded (Figure 3a), given the fact that levels higher than 23 dB
can cause problems in the understanding of speech and thus the
communication of people (Anon, n.r.). The intensity of the recorded
sounds is higher in the northwest side of the study area, where the
concentration of commercial/ recreational land uses is higher, and
therefore the higher number of daily discussions is held, especially
during working days and hours.
- The north-western part of the study area shows small
fluctuations, as shown in Figures 3a-3c. Recorded sounds are mostly
high during working hours (Figures 3a-3c). Minor fluctuations in
sound intensity are also recorded in areas located in the east of
the study area. St. George’s area, the University of West Macedonia
campus area and spaces around OSE (inactive train station) are the
quietest areas throughout the study area.
- Noise levels are a significant parameter of the urban
environment. In the case of Kozani this is quite evident while
observing the noise maps for the semi- pedestrianized city center
where the smallest range of peak sound levels is observed, as
opposed to the areas near major streets where larger peak sound
levels are observed.

Figure 3. Noise maps for Kozani. Source: Own
Elaboration. (click for larger size)
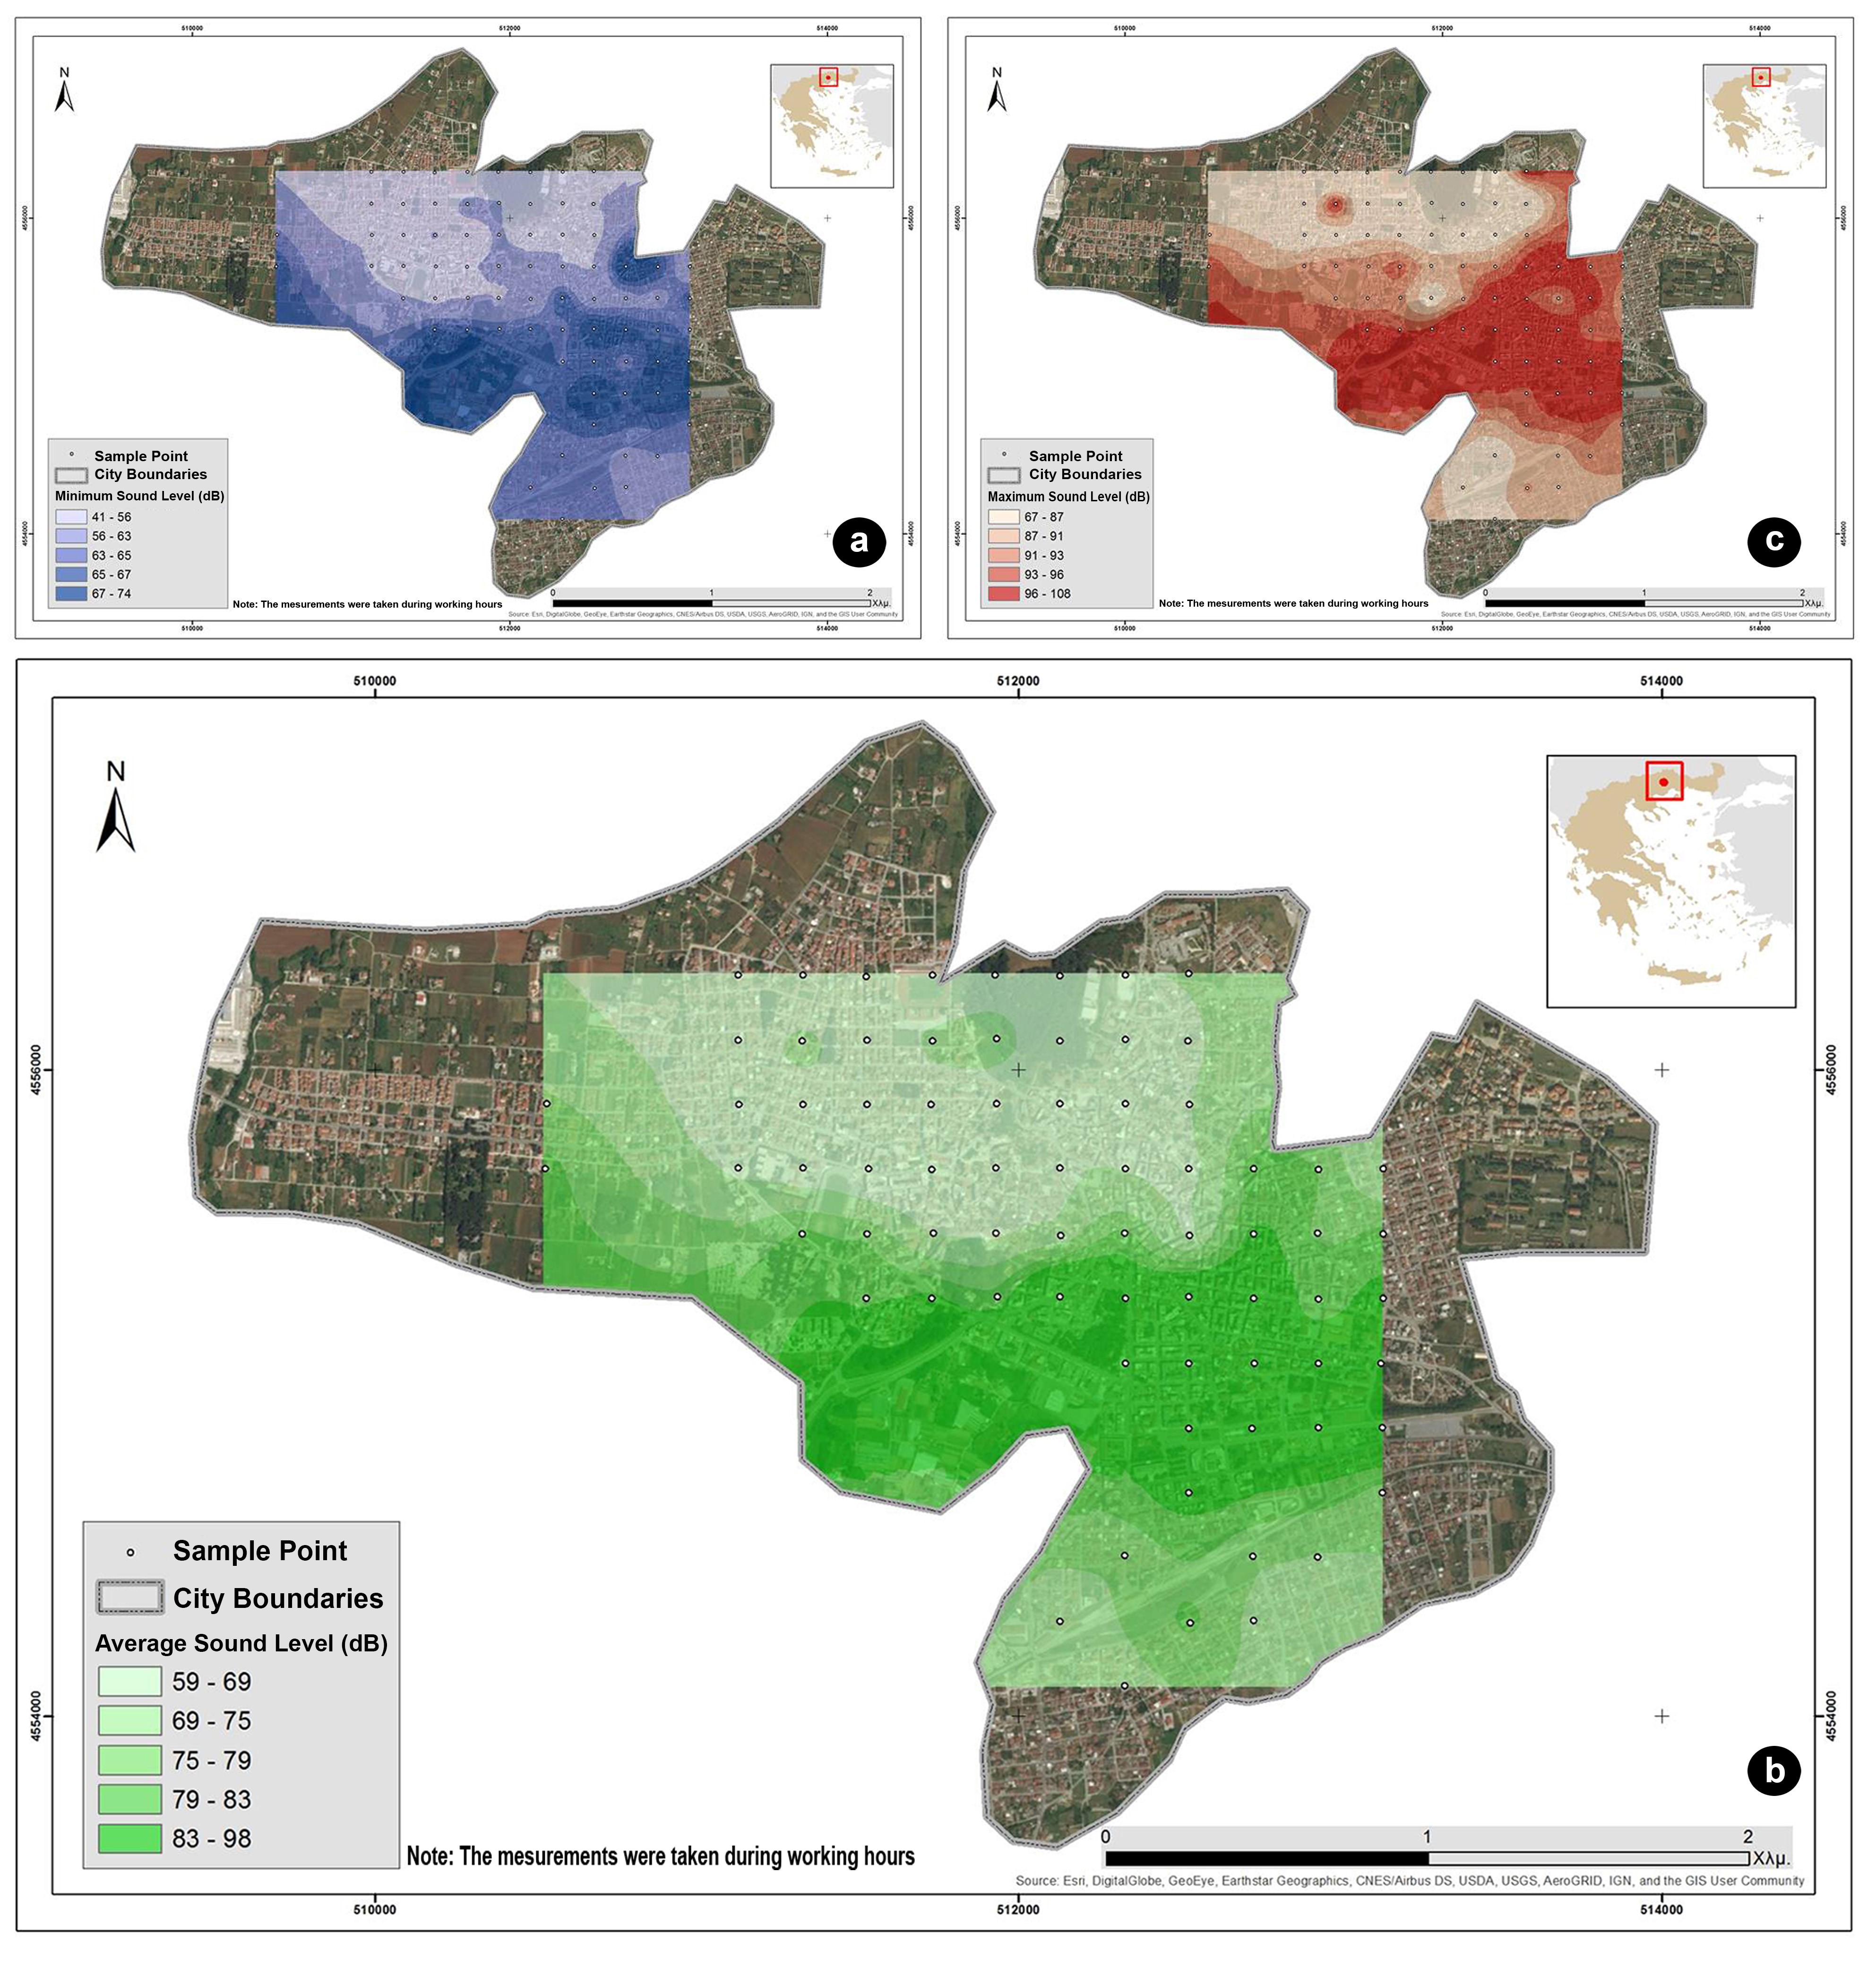
Similarly, the results for Drama can be concluded by the
following key points:

Figure 4. Noise maps for Drama.
Source: Own Elaboration. (click for larger size)
- Higher volumes were recorded in Drama compared to the city of Kozani. These, on
average, range from 59 to 98 dB. Recordings show that the intensity of the
recorded noise exceeds the threshold of 55 dB which, as previously noted, is the
noise level defined by the World Health Organization as the limit an excess of
which places people in a serious risk to their health
- The 87dB
threshold for the continuous 8-hour exposure, as set out in the
Greek Legal Framework, is surpassed in much of the city center study
area, even momentarily.
- Noise levels in central areas exceed the sound level of
41dB that allows people to communicate properly.
- As shown in Figure
4a there is no recording of less than 41 dB.
- Highest noise levels were recorded in central areas close
to main streets that attract large numbers of motorized vehicles
- The area around the OSE (inactive train station) appears
to have low noise levels, although adverse results were expected.
The local maximum levels are lower than those recorded at the city
centre, while the overall highest in the area are relatively low. In
overall there are small fluctuations observed in the area.
- As previously noted, the urban environment is
significantly associated with noise levels. This is quite obvious in
the case of Agia Varvara park, which seems to function as a sound
fence for its surroundings. The recorded average high and low sound
levels in the vicinity of the park are significantly lower than
those recorded throughout the city.
Summarizing the above, both cities encounter issues in terms of noise
pollution. Pollution is higher in the city of Drama although there are
larger green areas and measurements were taken in the summer period. The
greater extent of urban morphology in Kozani, along with the latest
pedestrianization projects in the city centre, appear to be the two key
elements contributing to the maintenance of lower noise levels.
As mentioned before, noise data for these two cities is now available
through OSM. Figures 5 and 6 present a part of each city map in OSM,
where the noise recordings are presented. Data were digitized by
the volunteers who were not trained due to the fact that they were
already familiar with the OSM. Instructions about the recording process
have been given and a pilot study was also implemented. It should be
mentioned that in case volunteers need to be trained, a short training
session could be organized, as Figure 1 presents.
Figures 5 and 6. Noise recordings in Kozani
(Fig.5-left) and Drama (Fig 6-right), presented in OSM. Source: Own
Elaboration. (click for larger size)
4. CONCLUSIONS
Noise mapping is a strategy established for monitoring noise levels
and protecting human health. Indeed, the European Directive
2002/49/EC proposed plans and maps which had to be implemented for
specific cities and transport infrastructures. Through this Directive, a
detailed methodology is proposed in which specific indicators should be
used. Although the results of this method are accurate, however, this is
a time-consuming and costly method. Thus, it is not possible to be
applied in medium and small sized cities for which the compilation of
noise studies is not compulsory by the law. In these cases, citizen
participation may help in the collection and publishing of the needed
data.
The aim of this paper is to develop a new methodology for noise
mapping. This methodology should be easily applicable and
cost-effective. Its rationale is based on community engagement and
volunteering. The following steps outline a simple and effective
strategy for mapping the noise levels in a city:
- Organizing the field systematic sampling,
- Preparing the volunteers who are responsible for
collecting the data and digitizing them in the OSM,
- Pilot study- Collecting the data,
- Developing the maps while simultaneously volunteers are
uploading the data in the OSM,
- Publishing the maps.
In cases of Kozani and Drama, the above methodology was applied.
Three volunteers from each city participated in this project. They
collected noise data for one week in each city by using their
smartphones. More specifically, they have used one free smart phone
application, named Sound Meter. These data are differentiated from the
data that should be collected according to the Directive 2002/49/EC
because: (a) they were collected at the street level, while the
Directive imposed that the recording should take place in the height of
4 meters and (b) recordings lasted for approximately 3-4 hours/day while
the Directive imposed that the recording should take place 24 hours/day.
The first issue should be further examined in order to adjust the
proposed limits of noise exposure taking into account the height in
which the recording are conducted. The second issue can be faced by
attracting volunteers in large numbers with various motivations. The
more people participate, the more recordings will be implemented.
However, taking into account the fact that there is no available data
for many Greek cities, satisfactory information is provided through this
methodology that can be helpful for researchers in order to understand
the soundscape of each city.
This has become obvious through the case studies presented above.
Through this methodology transport engineers, planners, decision makers
and citizens can understand how important it is to use sustainable means
of urban transport and to minimize road asphalt surfaces within city
centers. Indeed, through noise mapping in Kozani and Drama, results
showed that the street pattern (morphology, geometric characteristics,
land use, etc) is related to its soundscape. More specifically, it was
evident that in semi-pedestrianized areas, the noise levels were lower
while the opposite was observed in areas where roads with a high traffic
load are located.
It should be noticed that the recorded data is now presented at the
OSM and will be available (immediately and free of charge) for anyone.
OSM functions as an interactive map from which citizens can easily find
or transform the existing information presented in data point format.
However, until now it has not been possible for citizens to look at the
noise map produced by the team of experts. This is a problem which shall
be resolved in the next phase of this research. Also, an important
following step is the placement of a dynamic map on a public central
space. A dynamic map may be compiled with data collected by residents,
who will provide it by using specific apps through their smartphones by
which noise will be constantly monitored. This specific research may
play a catalytic role in informing and raising public awareness which is
crucial for the compilation of the Sustainable Urban Mobility Plans in
these cities. In the future, it would be crucial to test this
methodology in order to realize if it is applicable and provides
accurate data. To sum up, the methodology proposed above has the
potential to provide representative data in a cost-effective way.
Moreover, its use is based on community engagement and helps to inform
people about the quality of life in their cities and the projects that
may take place in the near future. Furthermore, these data are available
to everyone through OSM. Finally, there is room for improvement in order
for this methodology to be better applicable and readable, while it can
constantly provide noise information helping in noise monitoring at low
cost. Thus, this methodology may be an important tool for planners and
researchers aiming to contribute to the enhancement of the quality of
city life
REFERENCES
- Aiello, L.M., Schifanella, R., Quercia, D.
and Aletta, F., Chatty maps: constructed sound maps of urban areas
from social media data, Royal Society Open Science, ISSN: 2054-5703,
3(3). pp. n.r., 2016, DOI: 10.1098/rsos.150690
- Aletta, F. and Kang, J., Soundscape
approach integrating noise mapping techniques: a case study in
Brighton, UK, Noise Mapping, ISSN: 2081-879X, 2(1), pp. 1-12, 2015,
DOI: https://doi.org/10.1515/noise-2015-0001[Retrieved
on March 2017]
- Aletta, F., Masullo, M., Maffei, L. and
Kang, J., The effect of vision on the perception of the noise
produced by a chiller in a common living environment, Noise Control
Engineering Journal, ISSN: 2168-8710, 64(3), pp. 363-378, 2016, DOI:
https://doi.org/10.3397/1/3763786
- Alferez, J.R., Vanhooreweder, B., Segues,
F., Karkkainen, A., Giannopoulou, E. and Belluci, P., Report “Best
Practice in Strategic Noise Mapping” [Online] Available at:
http://goo.gl/GVwftf [Retrieved
on August 2017]
- Anon, Chapter 7, n.r. [Online] Available
at:
https://eclass.gunet.gr/modules/.../file.../
ΚΕΦΑΛΑΙΟ%207%20-%20ΗΧΟΡΥΠΑΝΣΗ.pdf [Retrieved on March 2017]
- Athanasopoulos, K. and Stratigea, A.,
Public participation in decision making process and the new legal
framework for spatial and environmental planning [, 4th National
Conference of Planning and Regional Development, Volos, 24-27
September 2015
- Bakogiannis, E., Kyriakidis, C., Siti, M.
and Eleftheriou, V., Four stories for sustainable mobility in
Greece, Transportation Research Procedia, ISSN: 2352-1465,24, pp.
345-353, DOI: 10.1016/j.trpro.2017.05.101
Bennett, G., King, E. A., Curn, J., Cahill, V., Bustamante, F. and
Rice, H. J., Environmental noise mapping using measurements in
transit, Proceedings of ISMA, 2010
- Cho, D. S., Kim, J. H. and Manvell, D.,
Noise mapping using measured noise and GPS data, Applied acoustics,
ISSN: 0003-682X, 68(9), pp. 1054-1061, 2007, DOI:
https://doi.org/10.1016/j.apacoust.2006. 04.015 [Retrieved
on March 2017]
- Directive 2002/49/EC of the European
Parliament and of the council of 25 June 2002 relating to the
assessment and management of environmental noise. Official Journal
of the European Communities, L 189/12 18.07.2002Garai, M. and
Fattori, D., Strategic noise mapping of the agglomeration of
Bologna, Italy, WIT Transactions on the Built Environment, 107. pp.
519-528, 2009, DOI: 10.2495/UT090461
- Garcia-Martí, I., Torres-Sospedra, J. and
Rodríguez-Pupo, L. E., A comparative study on VGI and professional
noise data, Connecting a digital Europe through location and place,
Proceedings of the AGILE 2014 International Conference on Geographic
Information Science, Castellon, 3-6 June 2014, ISBN: 9789081696043
- Geymen, A. and Bostanci, B., Production of
geographic information system aided noise maps, FIG Working Week
2012: Knowing to manage the territory, protect the environment,
evaluate the cultural heritage, Rome, 6-10 May 2012
- Kyriakidis, C., Citizen and city: Issues
related in public participation in the process of spatial planning,
3rd Pan-Hellenic Conference of Planning and Regional Development ,
Volos, September 2012
- Li, J. and Heap, D., A Review of Spatial
Interpolation Methods for Environmental Scientists, Cambera,
Australia: Geoscience Australia, ISBN 978 1 921498 28 2 (webcopy)
- Licitra, G. and Memoli, G., Limits and
advantages of good practice guide to noise mapping, Journal of the
acoustical society of America, ISSN: 0001-4966, 123(5), pp.
1401-1406, 2008
- Maffei, L., Di Gabriele, M. and Aletta, F.,
Soundscape variation in a historical city centre due to new traffic
regulation, Acoustics 2012, Hong Kong, 13-18 May 2012, DOI:
10.1121/1.4708901
- Margaritis, E. and Kang, J., Effects of
open green spaces and urban form on traffic noise distribution,
Forum Acusticum, Krakow, 7-12 September 2014,
- Margaritis, E., Aletta, F., Axelsson, O.,
Kang, J., Bootledooren, D. and Singh, R., Soundscape mapping in the
urban context: A case study in Sheffield, 29th Annual AESOP 2015
Congress, Prague, July 13-16, 2015, DOI: 10.13140/RG.2.1.5026.1607
- Pödör, A. and Révész, A., Noise map:
Professional versus crowdsourced data, Proceedings of the AGILE 2014
International Conference on Geographic Information Science,
Castellon, 3-6 June 2014, ISBN: 9789081696043
- Pödör, A., Révész, A., Oscal, A. and
Ladomerszki, Z., Testing some Aspects of Usability of Crowdsourced
Smartphone Generated Noise Maps, GI Forum 2015-Journal for
Geographic Information Science, ISBN:
978-3-87907-558-4/ISSN:2308-1708, 1, pp. 354-358, 2015, DOI:
10.1553/giscience2015s354
- Pödör, A. and Zentai, L., Educational
aspects of crowdsourced noise mapping, In: Peterson, M. (ed.),
Advances in Cartography and GIS Science: Selections from
International Cartographic Conference 2017, ISBN: 978-3-319-57336-6
(eBook), Omaha, NE: Springer International Publishing, pp. 35-46,
DOI: 10.1007/978-3-319-57336-6_3
- Poslončec-Petrić, V., Šlabek, L. and
Frangeš, S., With the Crowdsourced Spatial Data Collection to
Dynamic Noise Map of the City of Zagreb, International Symposium on
Engineering Geodesy SIG 2016, Varaždin, Croatia, May 20–22, 2016
- Poslončec-Petrić, V., Vukovićb , V.,
Frangeša , S. and Bačić, Ž., Voluntary noise mapping for smart
cities, ISPRS Annals of the Photogrammetry, Remote Sensing and
Spatial Information Sciences, III-4/W1, ISSN: 2194-9050 (Internet
and USB), pp. 131-137, 2016, DOI:
0.5194/isprs-annals-IV-4-W1-131-2016
Raymond, J., Sound Wave Equations Calculator-Science Physics
Formulas, n.r. [Online] Available at:
http://www.ajdesigner.com/phpsound/sound_wave_equation_spl_sound_
pressure_level.php [Retrieved on August 2017]
- Rodriguez-Manzo, F., Garay-Vargas, E.,
Garcia-Martinez, S., Lancon-Rivera, L. and Ponce-Patron, D., Moving
towards the visualization of the urban sonic space through
soundscape mapping, The 22nd International Congress on Sound and
Vibration (ICSV22). ISBN: 9781510809031, Florence, Italy, July
12-16, 2015
Schulte-Fortkamp, B. and Jordan, P., When soundscape meets
architecture, Noise Mapping Open, ISSN: 2084-879X (electronic
version), 3, pp. 216-231, 2016 DOI: https://doi.org/10.1515/noise-2016-0015
[Retrieved on August 2017]
- Schafer, M., The soundscape: Our sonic
environment and the tuning of the world, ISBN: 0892814551,
9780892814558, Simon and Schuster, 1993
- Schweizer, I., Bärtl, R., Schulz, A.,
Probst, F., & Mühläuser, M., NoiseMap-real-time participatory noise
maps, Second International Workshop on Sensing Applications on
Mobile Phones, 2011
Stoter, J., De Kluijver, H. and Kurakula, V., 3D noise mapping in
urban areas, International Journal of Geographical Information
Science, ISSN: 13658824, 13658816, 22(8), pp. 907-924, 2008, DOI:
http://dx.doi.org/10.1080/13658810701739039 [Retrieved on August
2017]
- Vasilev, A., New methods and approaches to
acoustic monitoring and noise mapping of urban territories and
experience of it approbation in conditions of Samara region of
Russia, Procedia Engineering, ISSN: 1877-7058, 176, pp. 669-674,
2017, DOI:
https://doi.org/10.1016/j.proeng.2017.02.311 [Retrieved on March
2017]
- Vogiatzis, K. and Remy, N., Soundscape
design guidelines through noise mapping methodologies: An
application to medium urban agglomerations, Noise Mapping, ISSN:
2081-879X, 4(1), pp. 1-19, 2017, DOI:
https://doi.org/10.1515/noise-2017-0001 [Retrieved on August
2017]
BIOGRAPHICAL NOTES
|
|
Bakogiannis Efthimios is a surveyor (Und.
Dipl, NTUA) and he has a Ph.D. in urban and transportation
planning (Ph.D.). He is a member in the Sustainable Mobility
Unit and he is an active practitioner in the fields of urban and
transportation planning.
|
|
|
Charalampos Kyriakidis is an Urban Planner
(Und. Dipl., University of Thessaly – M.Sc. UCL). He is
conducting a Ph.D. research in the field of urban design and
planning in the Department of Geography and Regional Planning in
NTUA. He is a member in the Sustainable Mobility Unit and he is
an active practitioner in the fields of his expertise.
|
|
|
Maria Siti is a surveyor (Und. Dipl, NTUA –
M.Sc. Un. of Strathclyde). She is conducting a Ph.D. research in
the field of urban planning in the Department of Geography and
Regional Planning in NTUA. She is a member in the Sustainable
Mobility Unit and she is an active practitioner in the fields of
surveying engineering and urban planning.
|
|
|
Nikolaos Kougioumtzidis is an undergraduate
student in the School of Rural and Surveying Engineering, NTUA.
|
|
|
Chryssy Potsiou is a Professor at NTUA. She
has 30 years experience in education, training and research.
Since 1982 she is active in the International Federation of
Surveyors (FIG) and currently she is the President of FIG. She
has organized several international conferences. She has been
contributor, co-author or main author of many publications and
has written more than 110 scientific papers.
|
CONTACTS
Dr. Efthimios Bakogiannis
National Technical University of Athens
School of Rural and Surveying Engineering
Department of Geography and Regional Planning
9 Iroon Polytechniou Str., Zografou Campus, 15780
Athens
GREECE
Tel. +30 210 772 11 53
Fax + 30 210 772 27 52
Email: ebako@mail.ntua.gr
Web Site: www.smu.gr
Mr. Kyriakidis Charalampos (c.Ph.D.)
National Technical University of Athens
School of Rural and Surveying Engineering
Department of Geography and Regional Planning
9 Iroon Polytechniou Str., Zografou Campus, 15780
Athens
GREECE
Tel. +30 210 772 11 53
Fax + 30 210 772 27 52
Email:
kyriakidisharry@gmail.com
Web Site: www.smu.gr
Mrs. Siti Maria (c.Ph.D.)
National Technical University of Athens
School of Rural and Surveying Engineering
Department of Geography and Regional Planning
9 Iroon Polytechniou Str., Zografou Campus, 15780
Athens
GREECE
Tel. +30 210 772 11 53
Fax + 30 210 772 27 52
Email: sitim.atm@gmail.com
Web Site: www.smu.gr
Nikolaos Kougioumtzidis
National Technical University of Athens
School of Rural and Surveying Engineering
9 Iroon Polytechniou Str., Zografou Campus, 15780
Athens
GREECE
Email: nickkouyioyi@gmail.com
Chryssy Potsiou
National Technical University of Athens
School of Rural and Surveying Engineering
Department of Geography and Regional Planning
9 Iroon Polytechniou Str., Zografou Campus, 15780
Athens
GREECE
Tel. +30 210 772 2688
Fax +30 210 7722677
Email: chryssyp@survey.ntua.gr